KV cache analytics for production inference
Your cache hit rate isn't enough.
A hit ratio says how often your cache helped. InferTap measures the two numbers it cannot carry: repeat compute — prefill the fleet paid for more than once — and duplicate KV footprint, the same content held in more than one cache at once. Per rank, fleet-wide, from your engines' own event sockets, outside the request path.
The stake grows with your topology. At DP=8 a node holds its shared prefixes eight times over, and behind a balancer that does not route on prefix, each instance recomputes what its neighbors already hold. Neither number appears on anything you run today. What they mean for your fleet is yours to decide — we report what happened, as a lower bound, with its coverage attached.
Specification
- input
- vLLM's own KV-cache event feed · read-only
- placement
- outside the request path
- measures
- repeat compute (GPU time) · duplicate KV footprint (GPU memory)
- attributed
- per rank · per workload · per model
- identity
- identical content is one value, across nodes and restarts
- network
- no inbound connections · no credentials · nothing sent to us
- output
- Parquet files on your disk · moved by your tooling
- build
- Rust · 9 direct dependencies · no unsafe code
① your deploy, marked on the chart ② the hour before, the hour after ③ duplication and repeat compute, each on its own
01 · See it work
A change you shipped, landing.
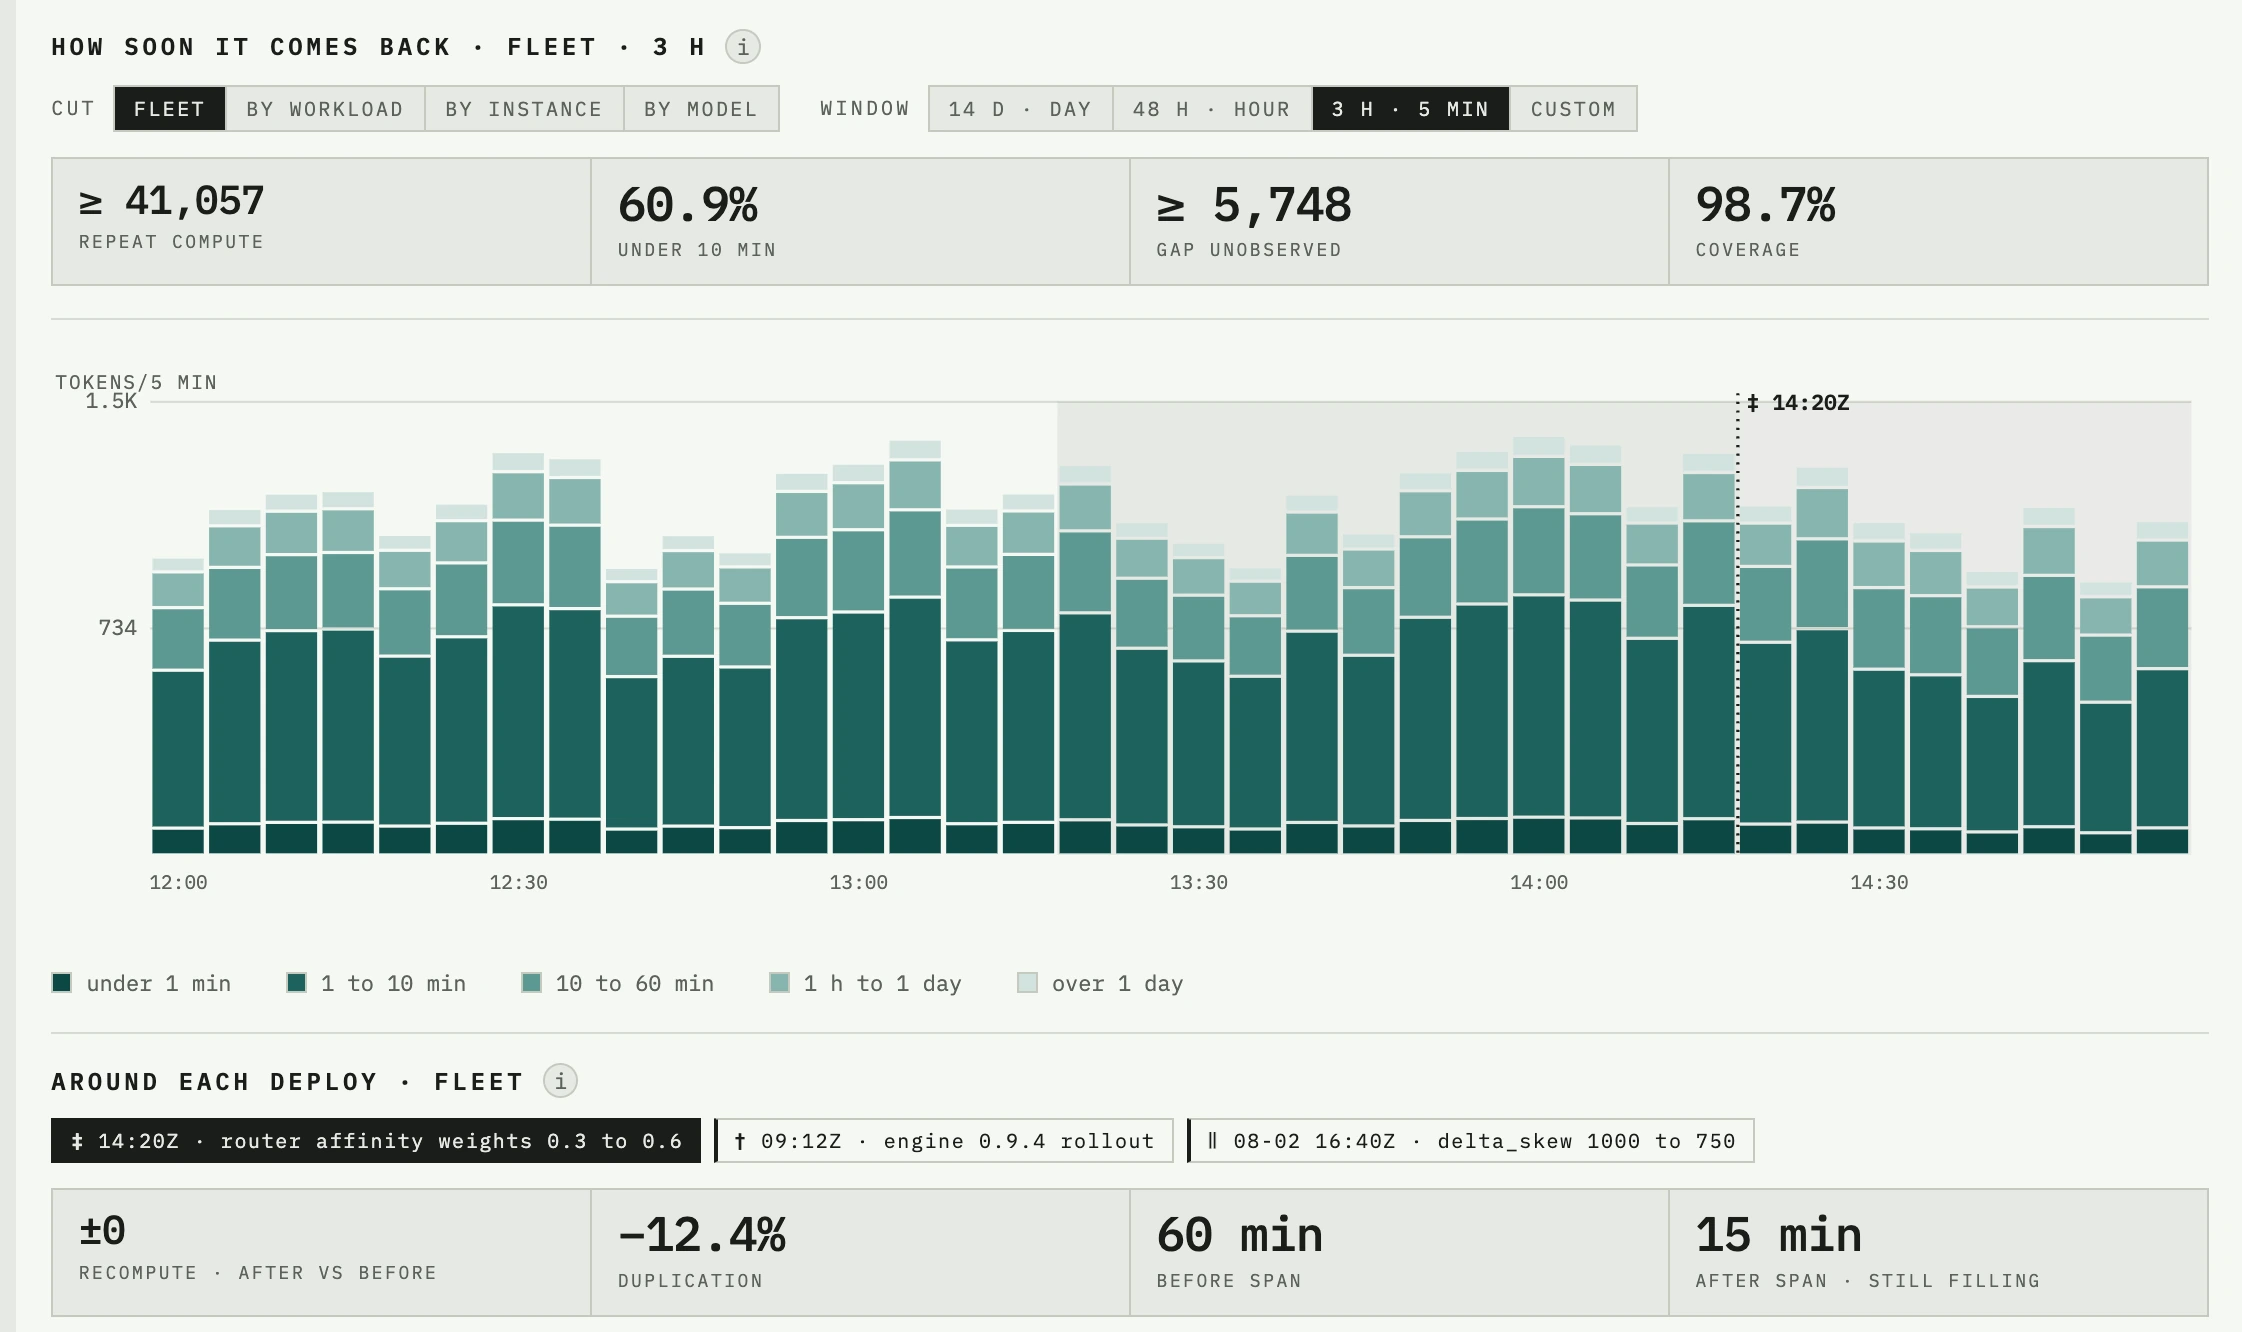
Declare a deploy — a label and an instant. Every chart carries it as a marker, and selecting it sets the hour before against the hour after, for each of the two numbers. No dashboard archaeology the morning after.

Step through the whole panel the way you would the morning after: two weeks, the three hours around the change, and the deploy selected — once where duplication fell, once where it rose.
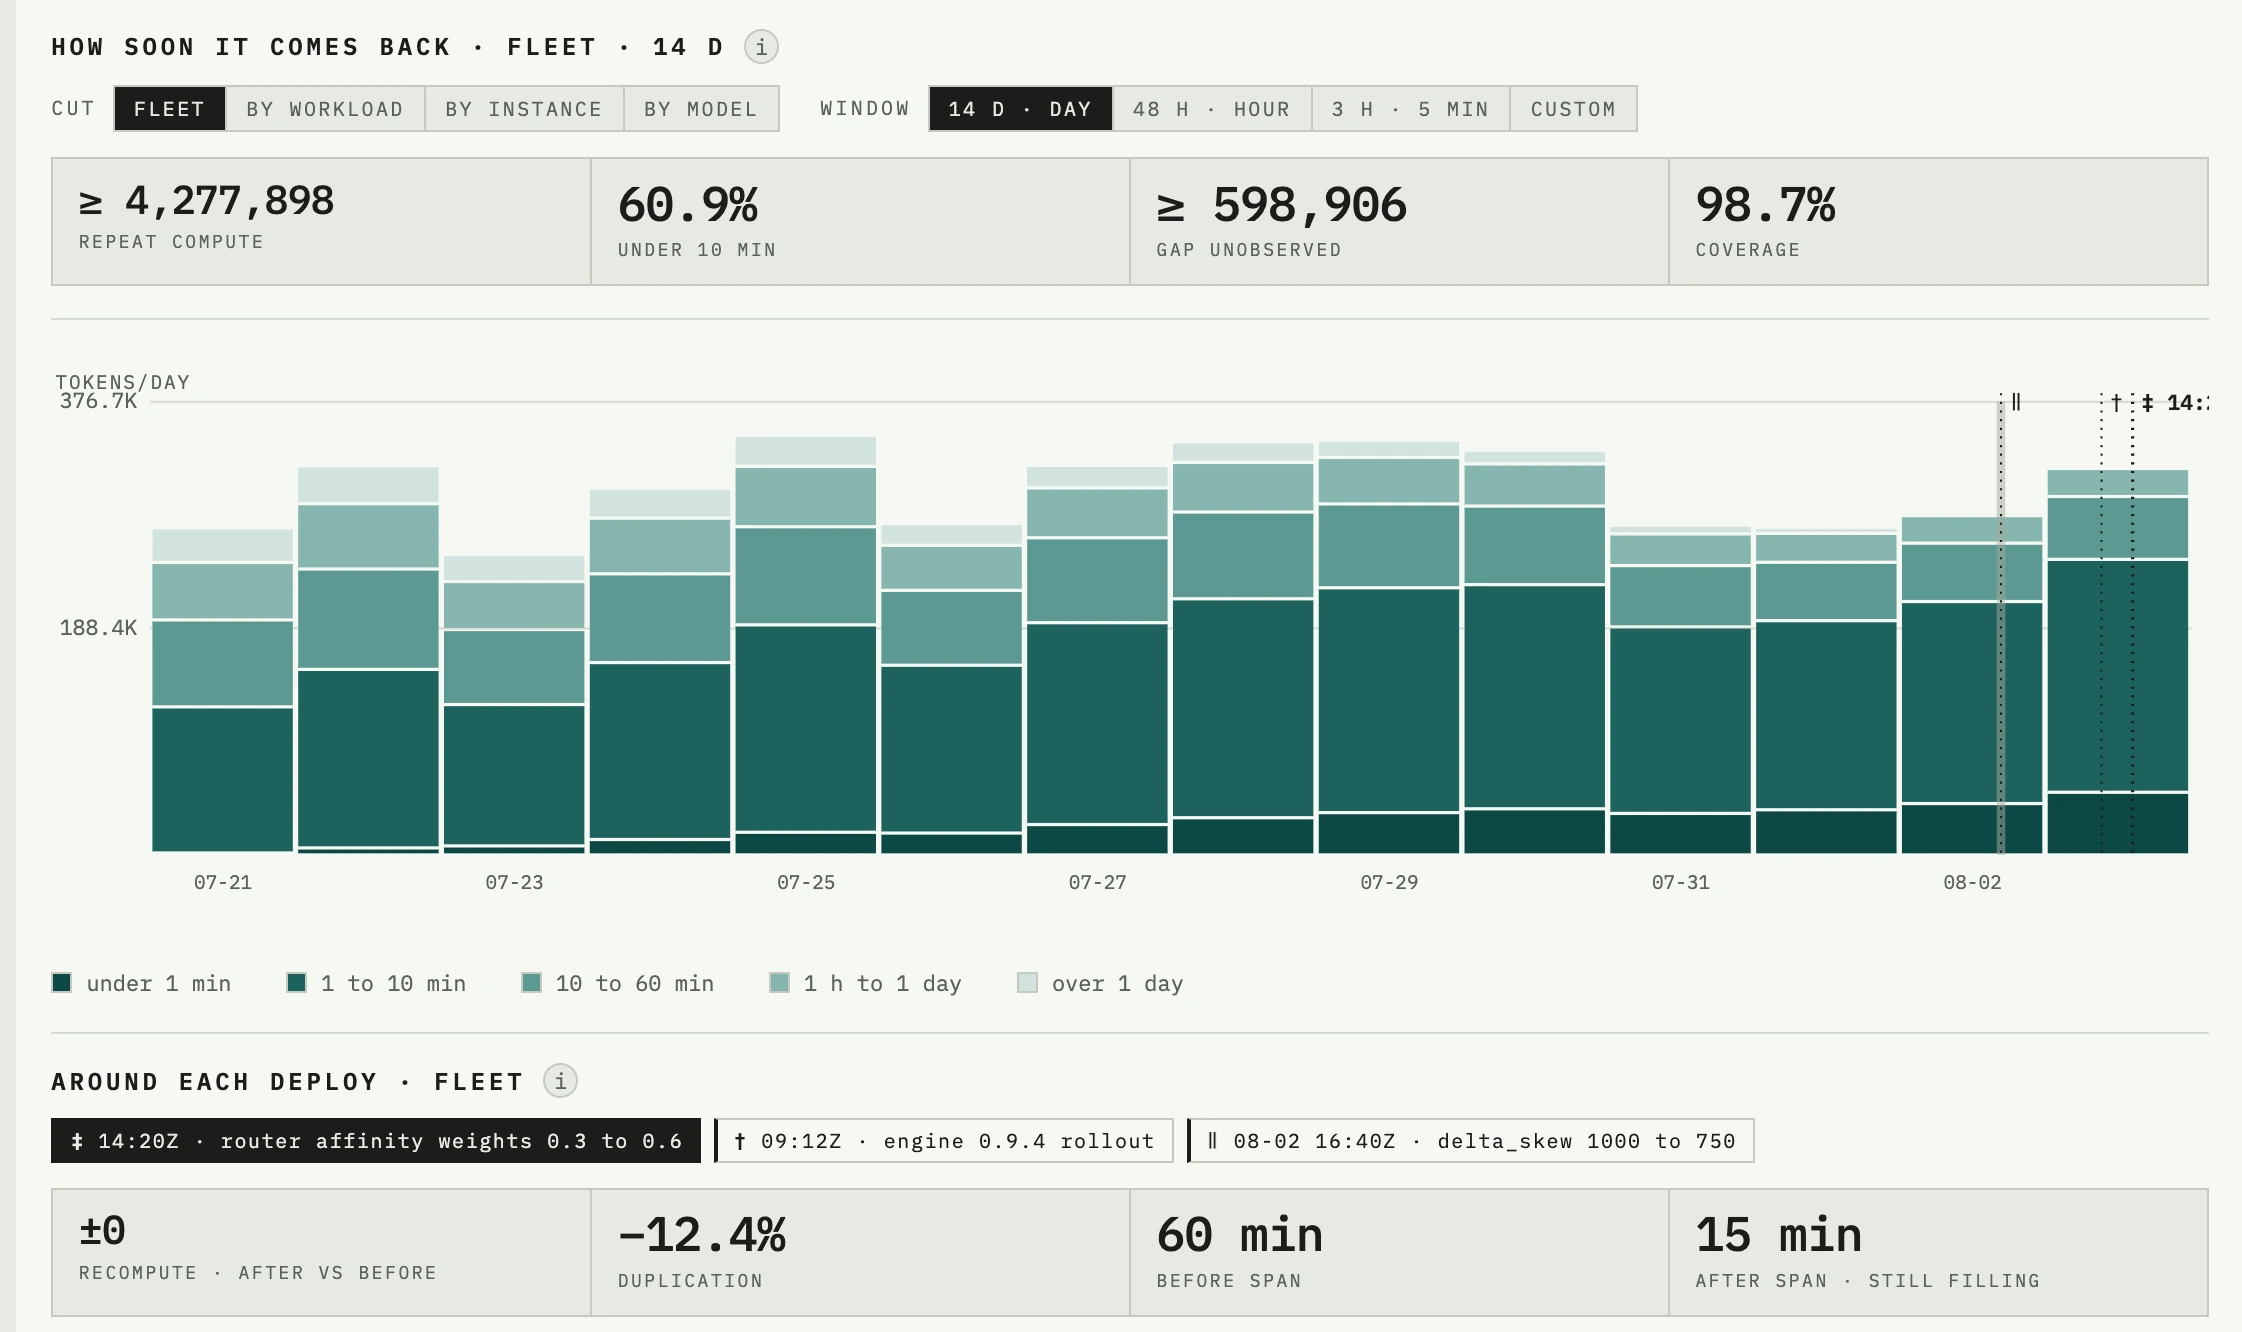
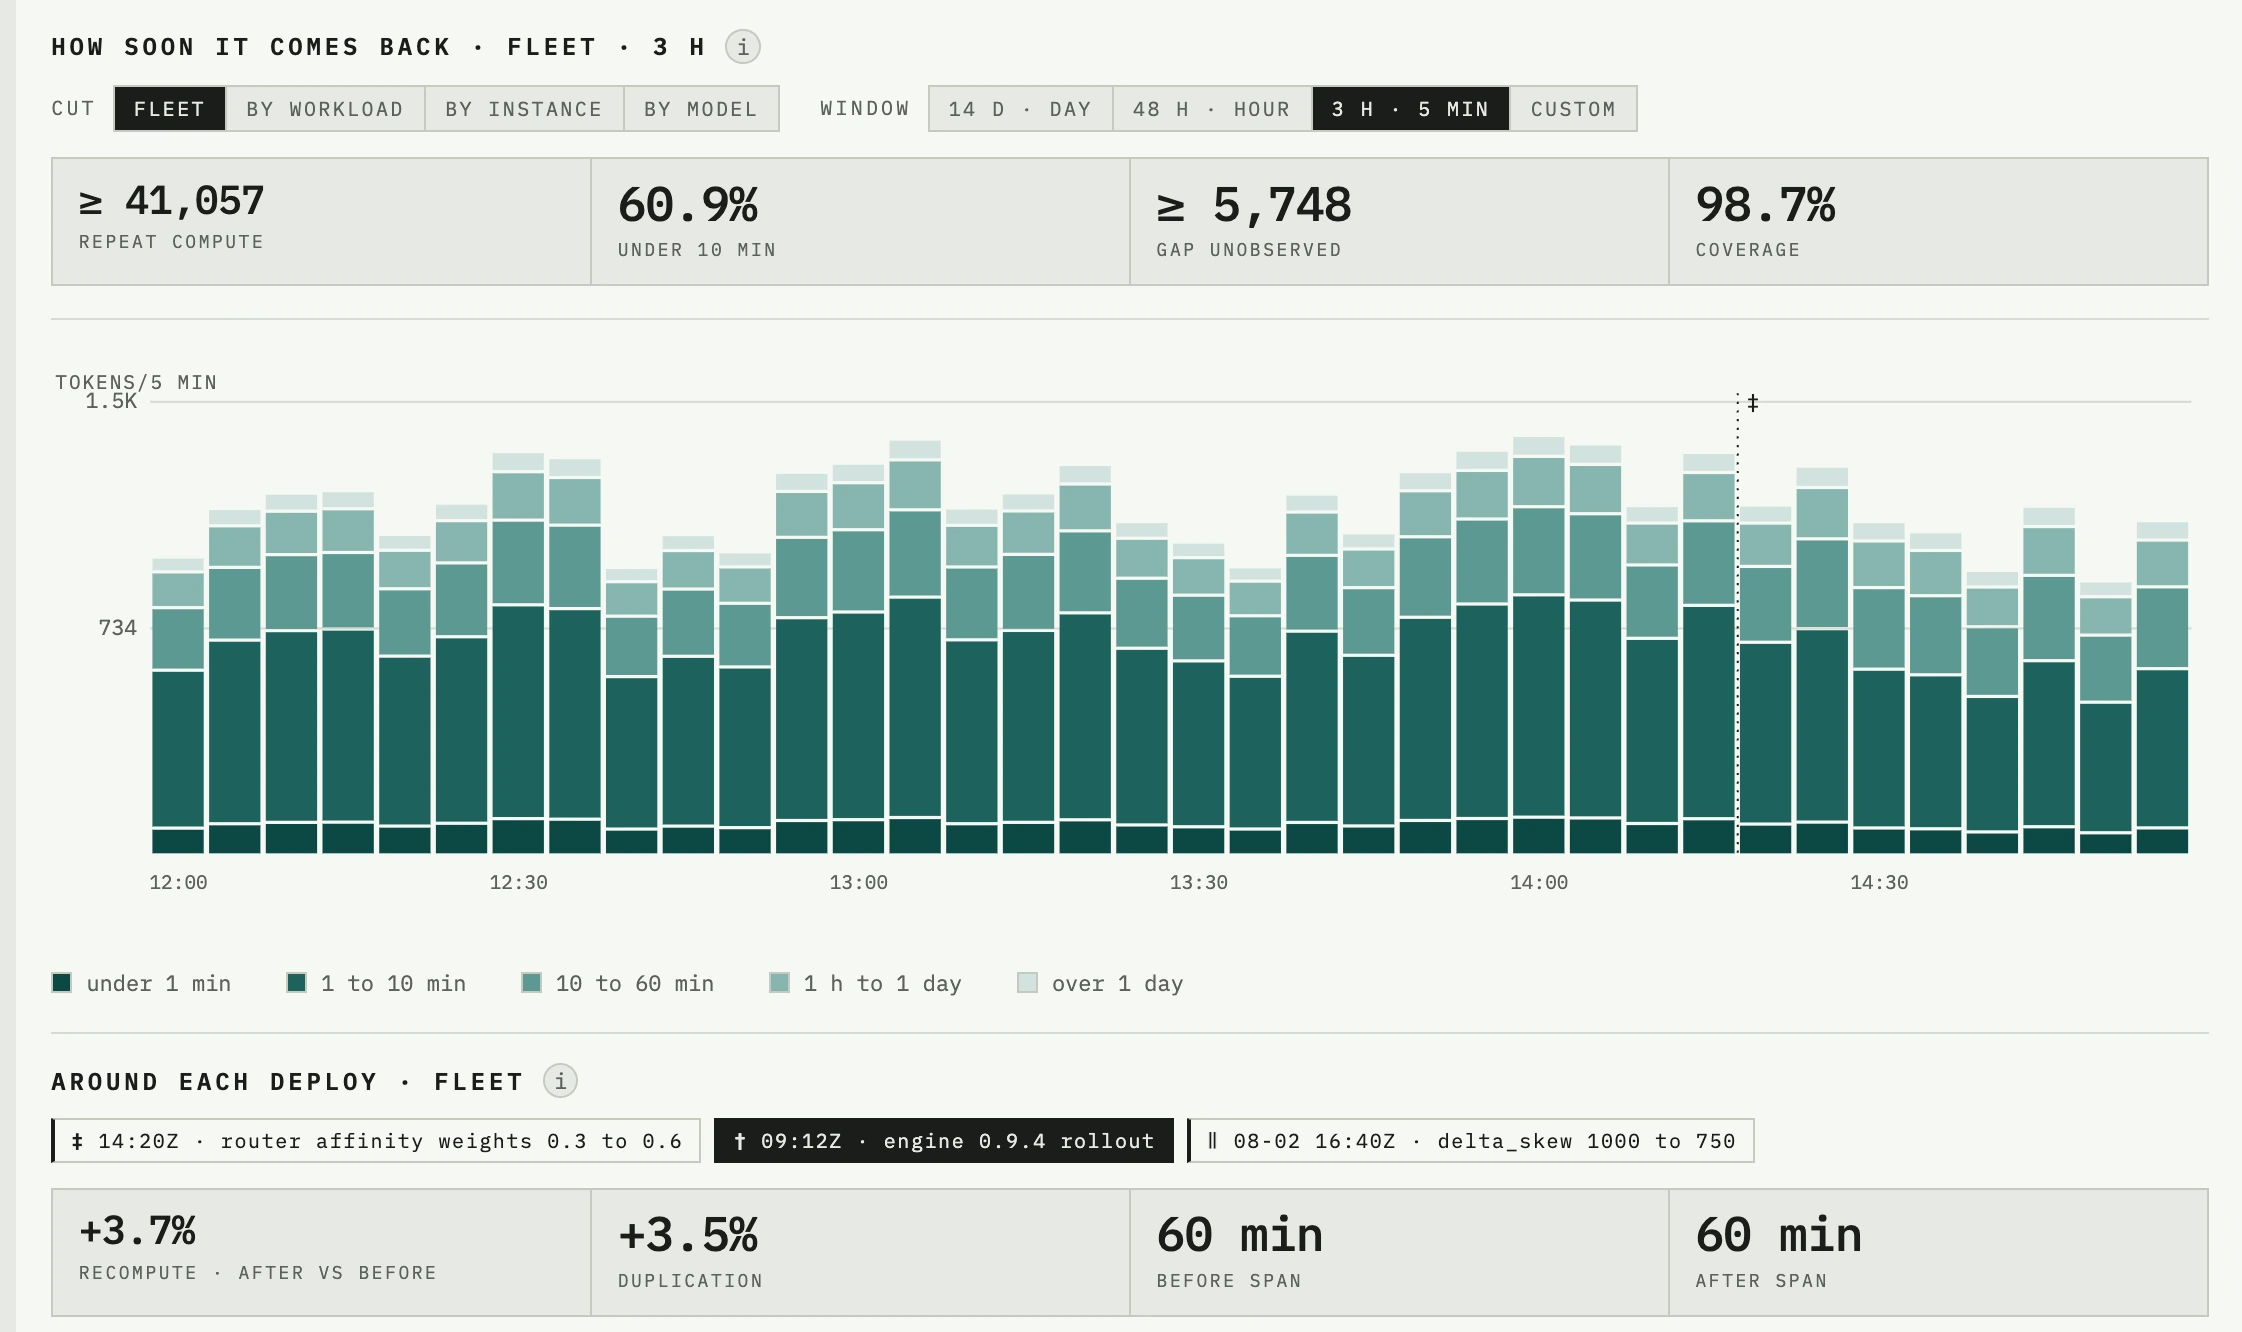
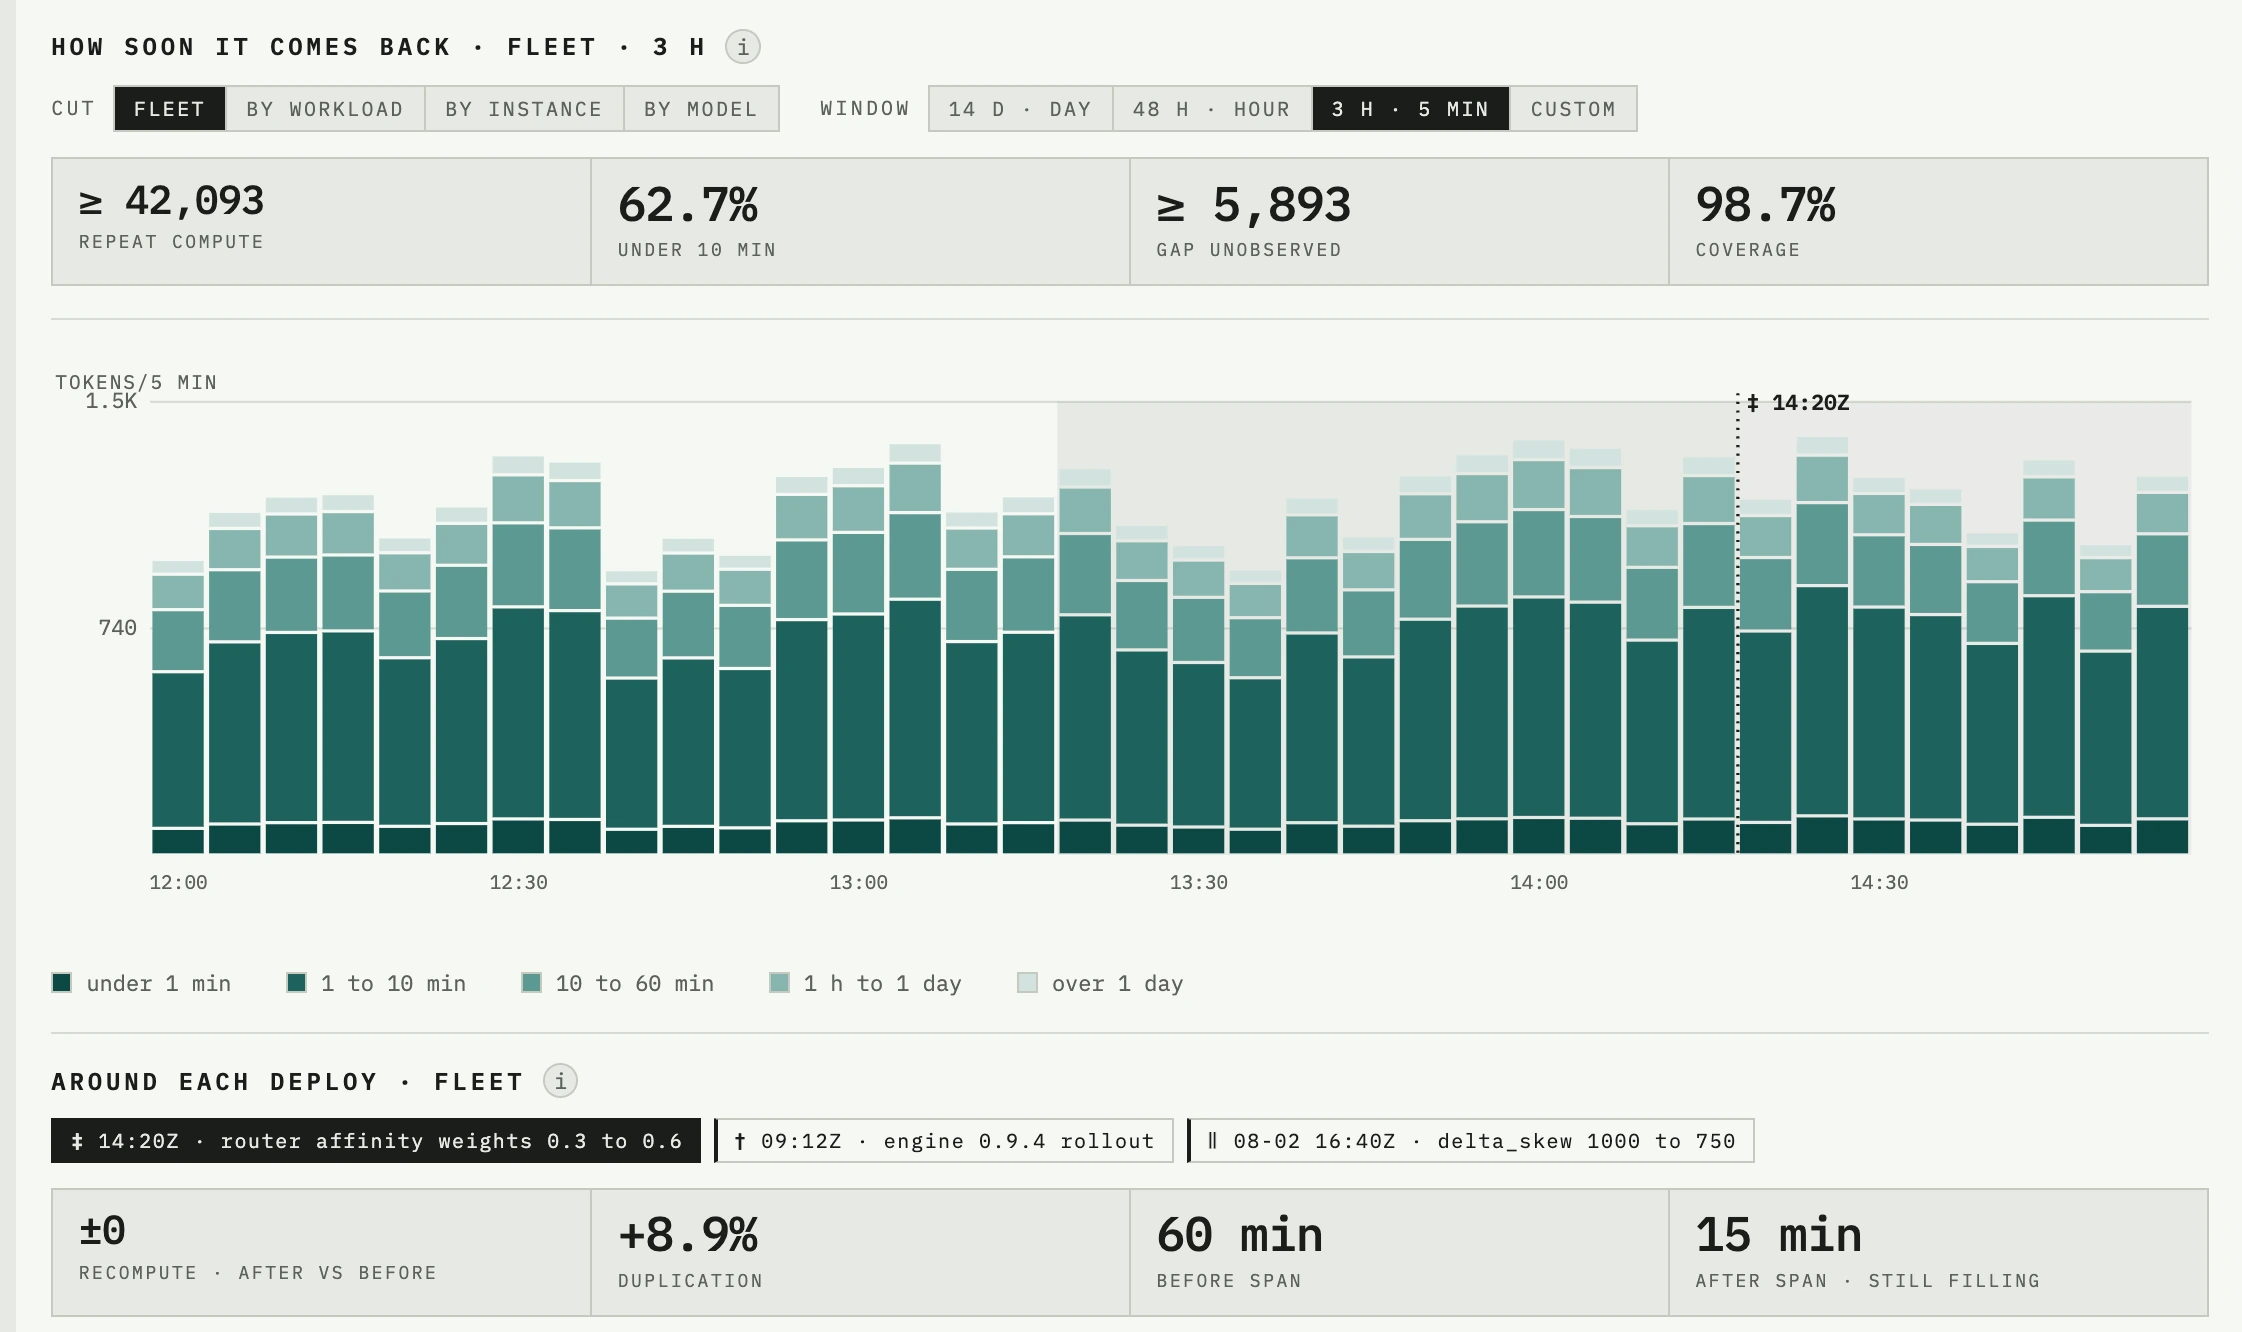
The deploy, selected: duplication down 12.4% against the hour before, repeat compute unchanged.
02 · What it counts
Three quantities, separated by cause.
Repeat compute is GPU time your fleet already spent once; the duplicate footprint is GPU memory holding what another rank already holds. They are never added together. Each lives on the console above: its trend with your deploys marked on it, cut by workload, model and rank, and a drill-down to the records behind any number.
-
Evicted, then recomputed
Tokens that were stored, evicted, and then stored again on the same engine. Prefill the fleet paid for more than once, counted per rank rather than averaged over a node.
GPU time · per rank
-
Recomputed after cache clear
The same quantity, separated by cause: tokens recomputed after an operational flush rather than after eviction under pressure. Two different owners, kept apart, because once summed the two causes can never be told apart again.
GPU time · per rank
-
Duplicate KV footprint
The same content resident on more than one rank at the same instant. It moves with your instance count and your rank shape. Prefix-aware routers already track where blocks live, because they use it to place requests, but none of them report it back to you as a quantity.
GPU memory · per rank
03 · What you decide with it
Each quantity is an input to a different decision.
Separated by cause, because the causes are not interchangeable and cannot be told apart once summed. What any of them warrants on your fleet depends on your traffic and your shape, and we would be guessing if we told you now. These are the decisions the quantities inform, not the decisions themselves.
- Evicted, then recomputed Capacity and policy Pressure and policy churn produce the same total and different distributions across ranks. This is that distribution, at the grain where the two stop looking alike.
- Recomputed after cache clear Restart behaviour Same GPU hours, different cause, usually a different owner: flushes follow restarts and config changes, not load. Once summed the two can never be separated again, so they never are.
- Duplicate KV footprint Prompt mass A 400-token system prompt across twenty caches is arithmetic you can do yourself. The prefix your stack assembles is not: tool schemas, few-shot blocks, retrieved context, moving with every framework upgrade and resident once per rank all the same. It is the one term you can cut once and have it count everywhere, instead of fighting the number of caches.
- Duplicate footprint, shared by part of your traffic Prefix-aware routing llm-d and AIBrix send matching prefixes to one instance, consolidating overlap between pods. Whether that is worth deploying depends on how much of yours is that kind.
- Duplicate footprint, inside one instance Rank shape Data parallelism replicates the whole cache per rank; tensor parallelism shares one and pays interconnect for it. Ten nodes at DP=8 hold their shared trunks eight times over, and no router reaches inside an instance today.
- A change you shipped Before and after Prompt rewrites, engine upgrades, capacity and routing changes. Every figure carries a daily trend, and a trend crossing a rules change shows you where the rules changed instead of quietly summing numbers that were never comparable.
- Any of them Nothing Batch and offline fleets churn cache by design, so a high figure there is the shape of that workload rather than a problem with it. Whether it warrants action stays your call, and a flat baseline is what makes the next change visible.
04 · Why nothing you run can
Four things are gone before a metric ever reaches you.
Your engine's cache metrics are aggregate, anonymous and per-instance.
Four properties are discarded inside the process before
anything reaches /metrics, and anything needing
one of them cannot be recovered by scraping more often.
Two more are facts about your deployment that no endpoint reports at all: how many instances sit behind a load balancer that does not route on prefix, and whether an agent framework assembles your prefix. What replaces them is in What it measures: the two numbers, what comes attached to each one, and the metrics you can scrape yourself.
- Identity
- which block: a histogram of lifetimes never becomes a token count
- Cause
- why: “evicted under pressure” and “flushed by a restart” land in the same bucket, with different owners and opposite fixes
- Elsewhere
- what the other caches held at that moment; every metric above is per-instance and cannot be joined afterwards
- History
- the events, not the summary
One identity, fleet-wide
Whether two engines call the same prompt the same thing depends on their hash settings. One algorithm seeds from a random root per process, so sibling workers disagree and a node does not match itself after a restart. The default hashes content, and two engines agree only while they run the same version and configuration. Either way, no metric carries a block id, so nothing counts the copies. InferTap derives its own identity from what a block holds, rooted at a fixed constant, so identical content is the same value across processes, restarts, nodes and engine versions. Your fleet becomes one thing you can count instead of a hundred caches nothing joins.
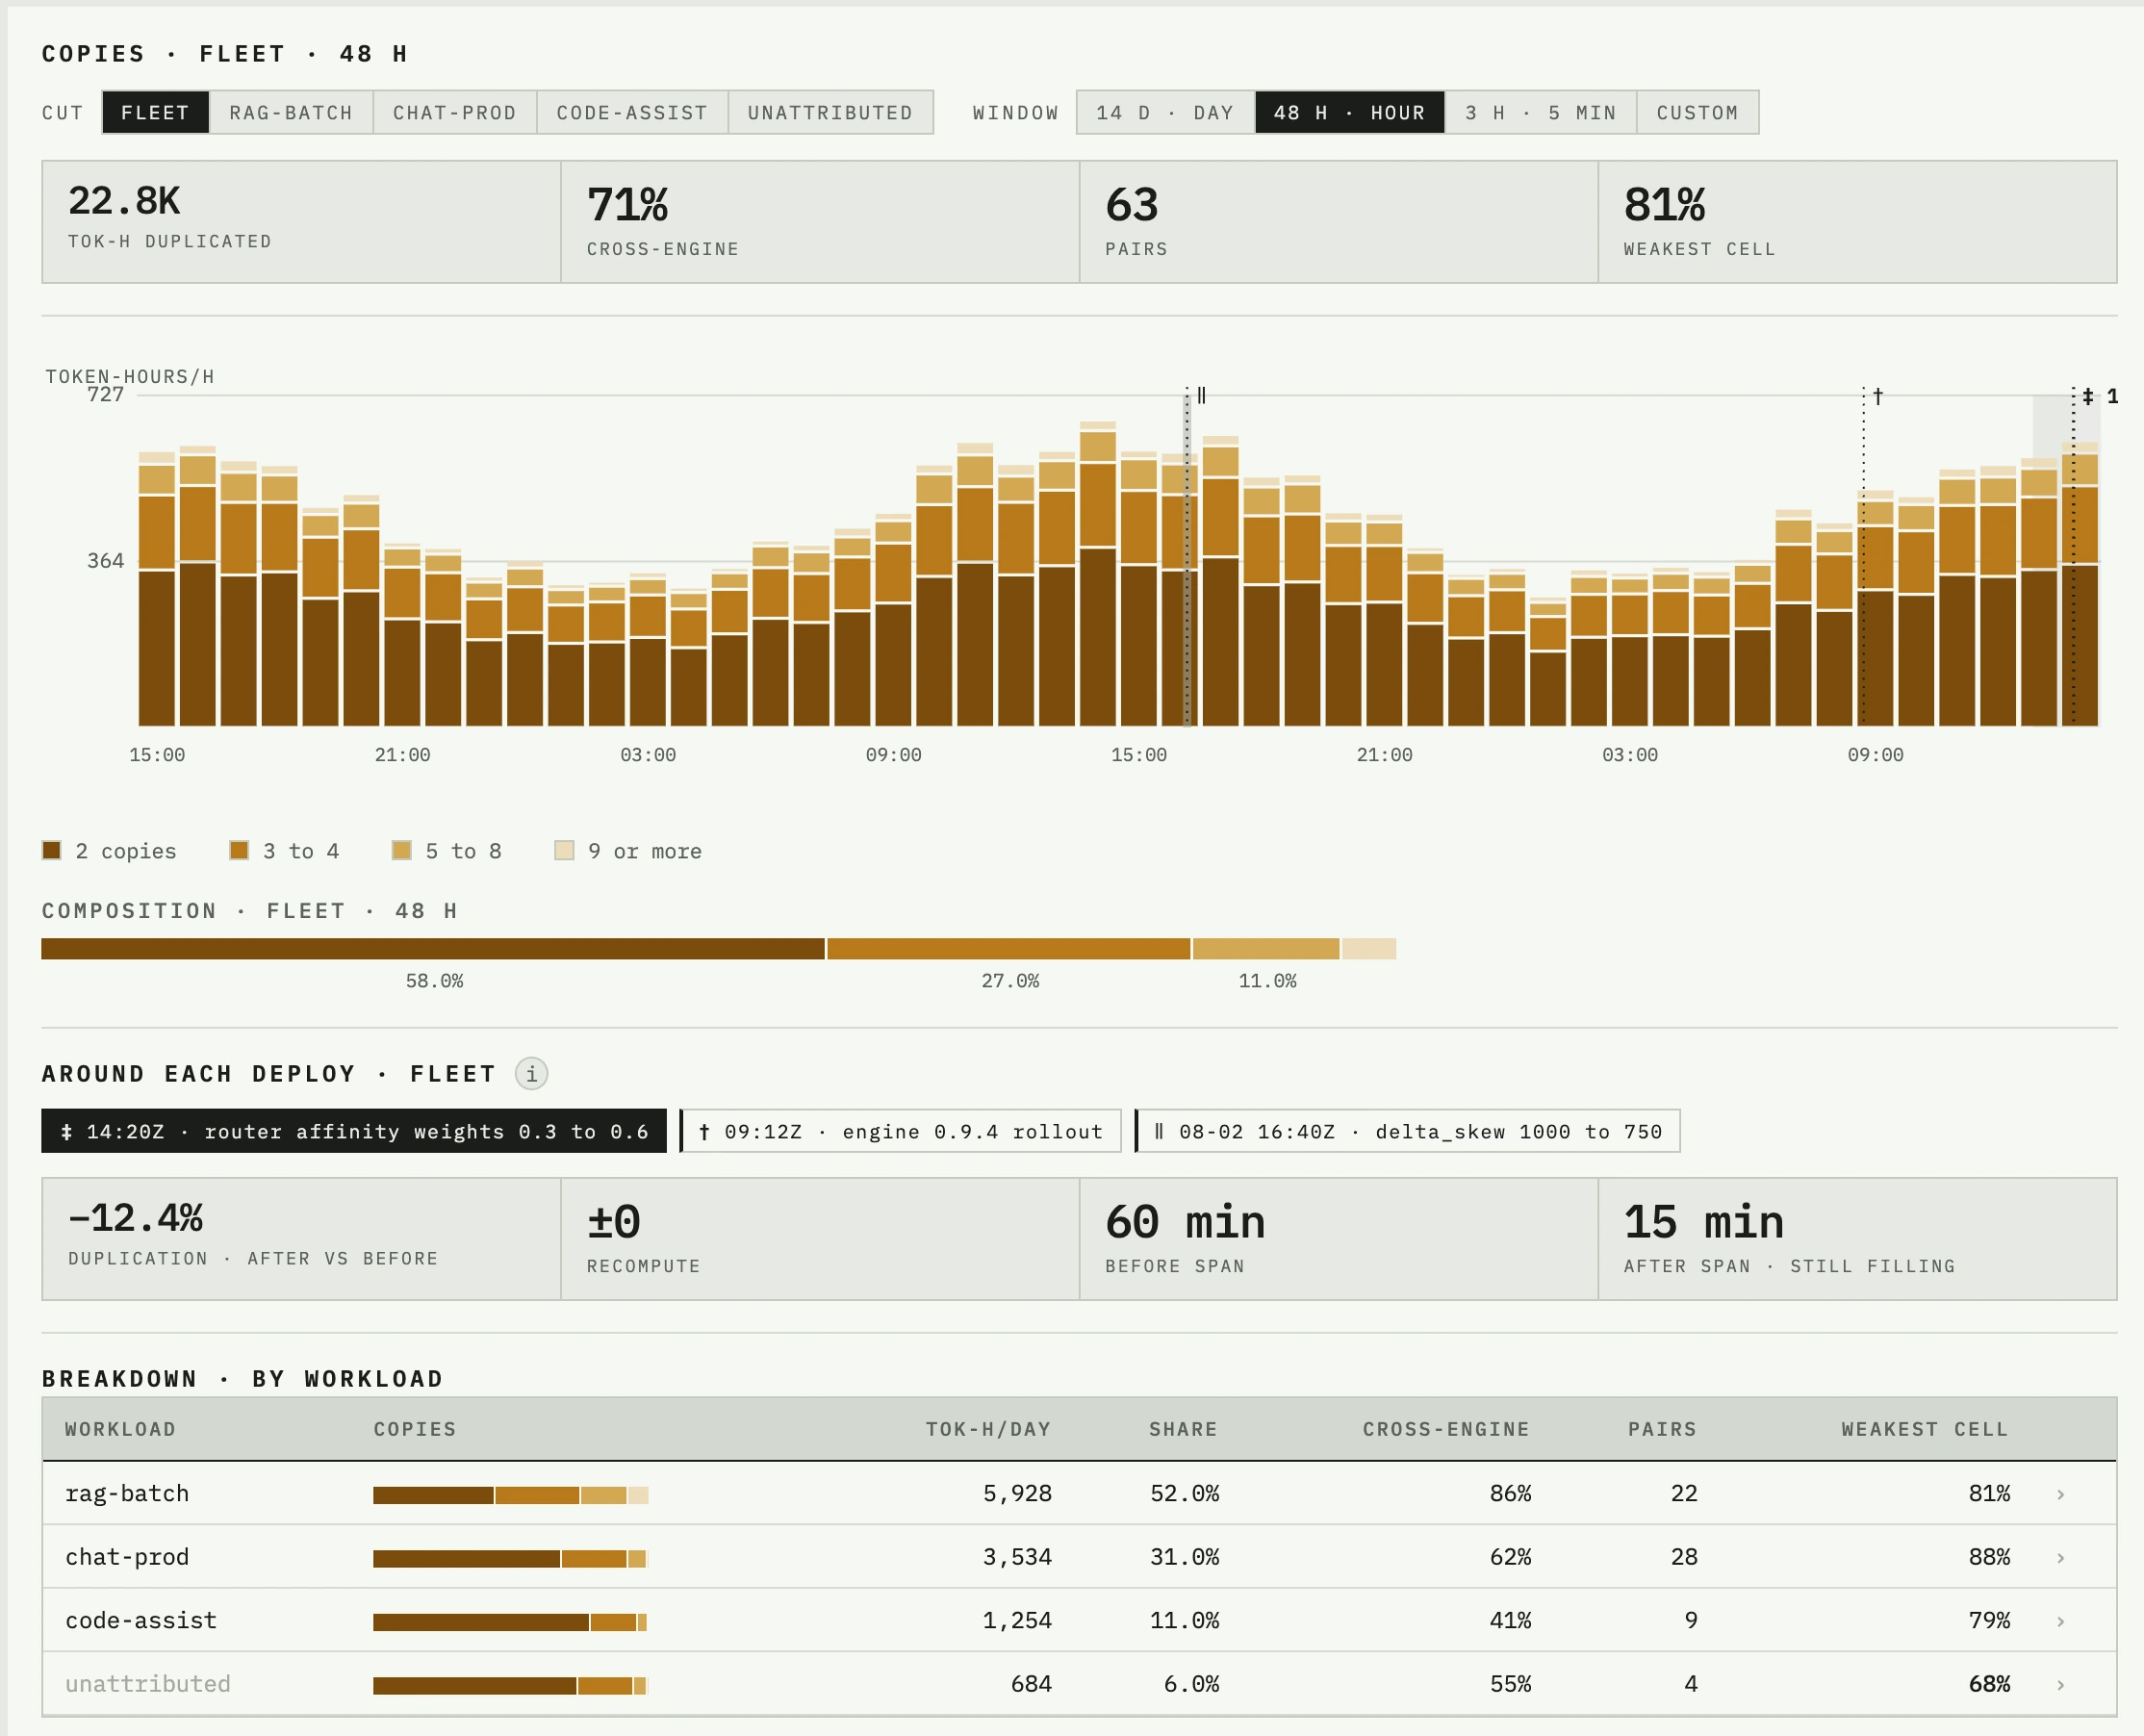
① how many copies existed, hour by hour ② the split by copy count, over the two days ③ the same, workload by workload
05 · What it takes to run
One tap per engine. One analyzer for the fleet.
Nothing changes in your serving path: no SDK, no proxy, no code change — a read-only subscriber beside each engine. Each vLLM instance gets its own, so a TP=4 node hosting two instances runs two taps. One socket per process is deliberate: a single process fanning in several sockets lets a busy one starve the rest. The analyzer is a single VM for the whole fleet, and to leave you stop the taps and delete a directory.
Hand this to your security review
- Subscribes to the vLLM KV-event sockets you list and opens nothing else. No inbound connections, and it never calls out to us.
- Never touches your inference API, holds no credential, and writes metadata-only records to one directory on local disk.
The full version, with each claim named against the test or the systemd directive that enforces it, is the trust page.
Transport is yours
Records land on local disk as Parquet, one file per sealed segment, so your existing tooling reads them without anything of ours in the path: rsync, an object store, a data lake that queries the files where they land, a mounted volume, or physical media if that is your posture. Nothing in that path is ours to trust, so an air-gapped fleet needs no exception made for it.
Get in touch
Interested?
Send your GPU count, your rank shape, and what your
/metrics endpoint shows. That is enough for us to tell
you what this would measure on your fleet, and to say so plainly if the answer
is not much.